Tag Archives: Data

NOTE: Updated code 10-27-2018

In this day and age where everything is measured, recorded, and available remotely (via a REST API most of the time!), it really bothered me that our heating oil tank measured the remaining gallons of oil by a crude plastic dip stick. It’s not accurate, there is no historical data, and there is no way to audit (for honesty, accuracy, or problems/errors).

So the problem is simple enough: Find a quick and easy way to remotely monitor the number of gallons of heating oil in a home, and alert at pre-set intervals (let’s say 75%, 50%, and 25%) of remaining oil in the tank.

After looking for commercial solutions, the cheapest one I found is $120 with a $10/year fee. In my view, that’s simply ridiculous. I decided that I could build something better for 1/3rd of the price ($40), without an yearly fee.

Hardware How-To

Start with this Instructable I created with the exact parts/steps, and with lots of pictures:
https://www.instructables.com/id/Monitor-Heating-Oil-Tank-Gallons-With-Email-SMS-an/

This should take care of the hardware side.
Continue Reading →DIY – Monitor Heating Oil Tank Gallons with Pushbullet, SMS, and Email Alerting
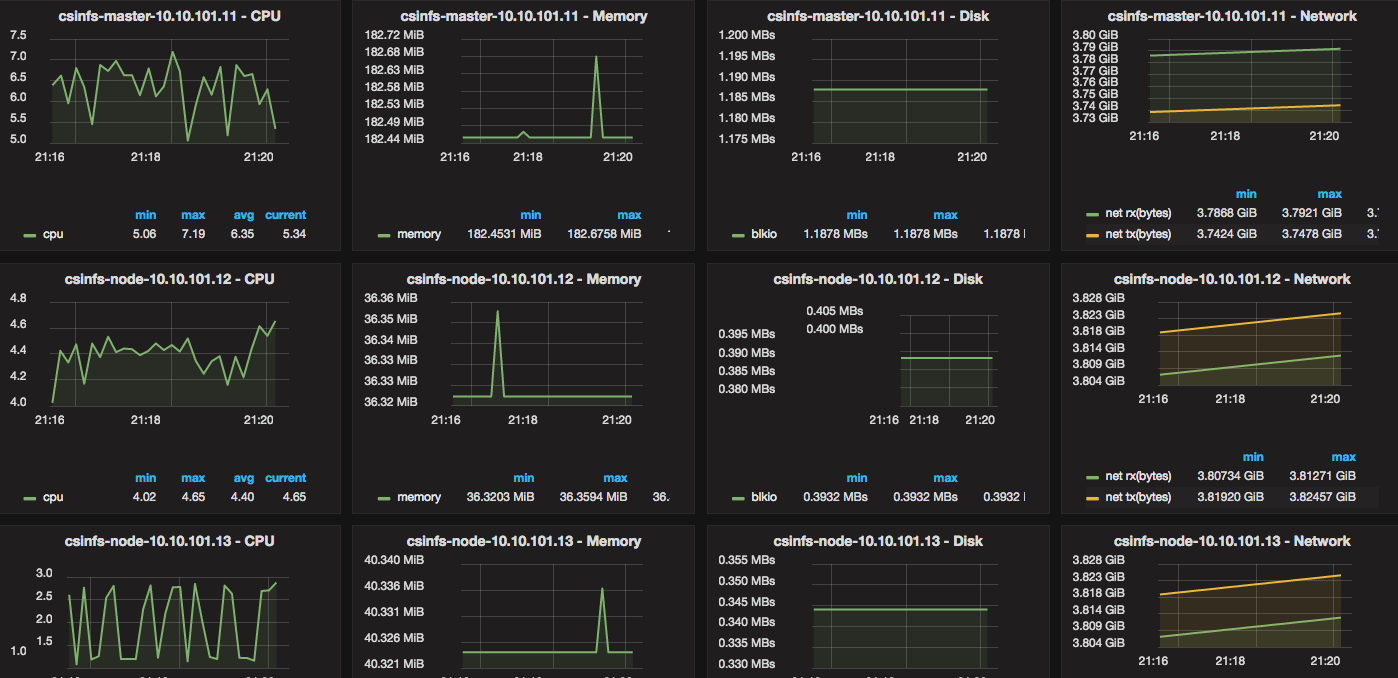
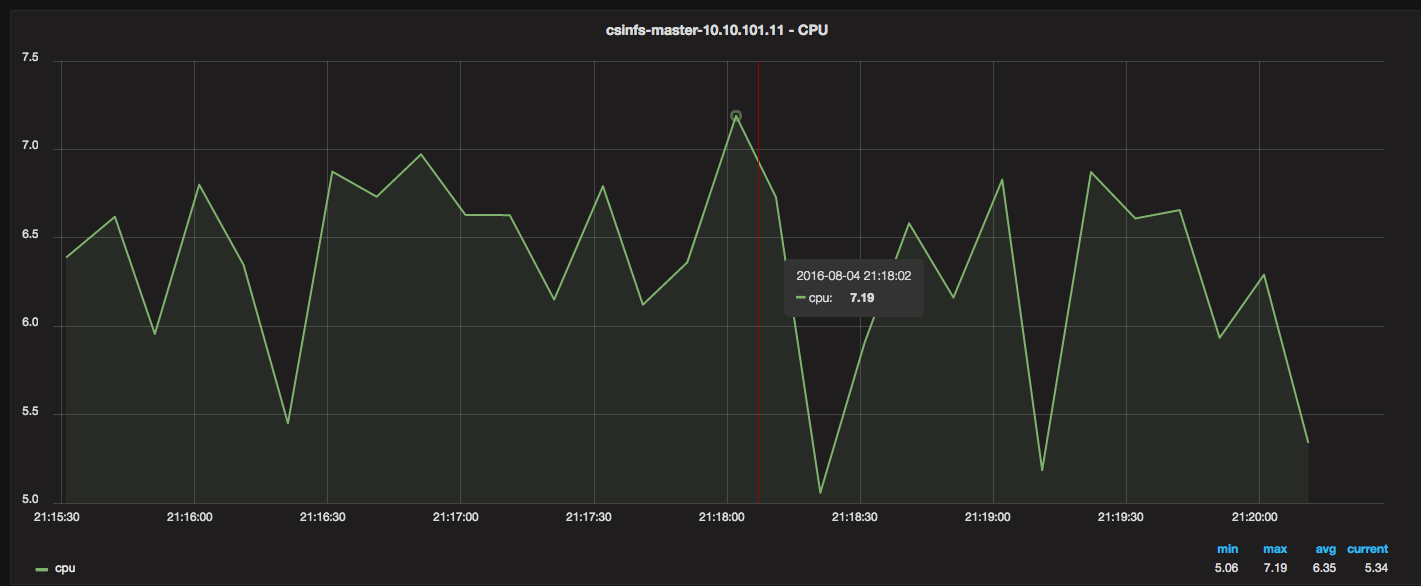
I needed a way to monitor Docker resource usage and metrics (CPU, Memory, Network, Disk). I also wanted historical data, and ideally, pretty graphs that I could navigate and drill into.

Whatever the solution was going to be, it had to be very open and customizable, easy to setup and scale for a production-like environment (stability, size), and ideally cheap/free. But most of all — it had to make sense and really be straight forward.

3 Containers and 10 minutes is all you need

To get this:
docker_metrics01

docker_metrics02
There are 3 components that are started via containers:

Grafana (dashboard/visual metrics and analytics)
InfluxDB (time-series DB)
Telegraf (time-series collector) – 1 per Docker host

The idea is that you first launch Grafana, and then launch InfluxDB. You configure Grafana (via the web) to point to InfluxDB’s IP, and then you setup a Telegraf container on each Docker host that you want to monitor. Telegraf collects all the metrics and feeds them into a central InfluxDB, and Grafana displays them.

Setup Tutorial/Examples

Continue Reading →Monitor Docker resource metrics with Grafana, InfluxDB, and Telegraf