I needed a way to monitor Docker resource usage and metrics (CPU, Memory, Network, Disk). I also wanted historical data, and ideally, pretty graphs that I could navigate and drill into.
Whatever the solution was going to be, it had to be very open and customizable, easy to setup and scale for a production-like environment (stability, size), and ideally cheap/free. But most of all — it had to make sense and really be straight forward.
3 Containers and 10 minutes is all you need
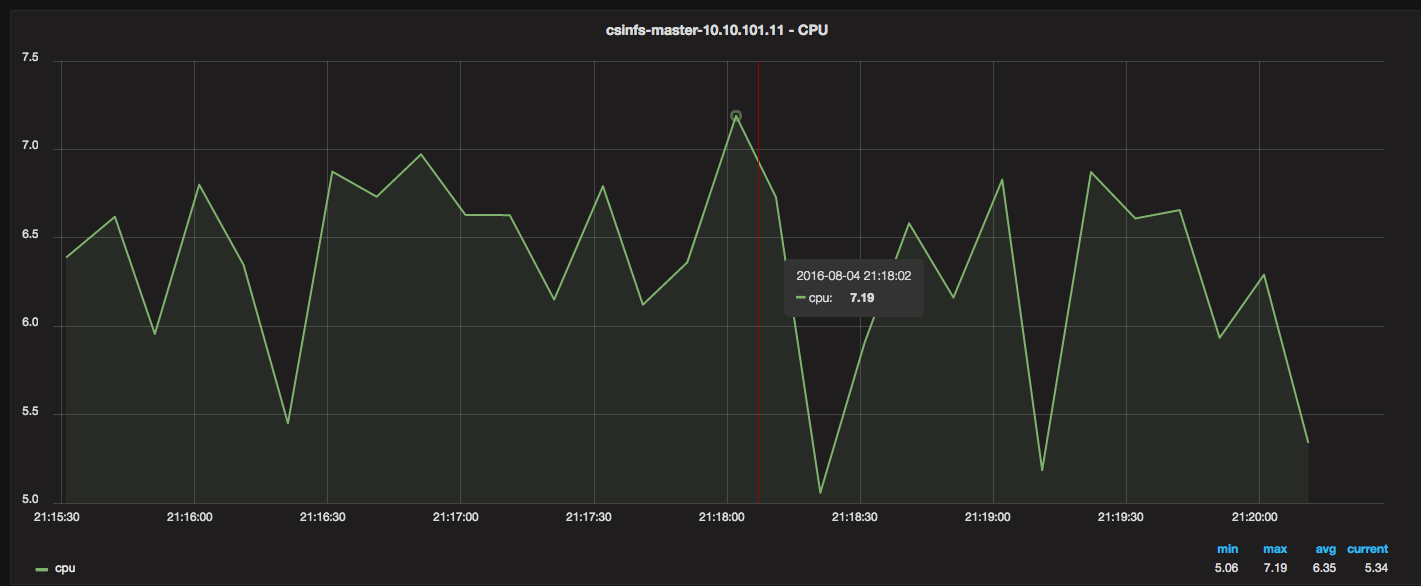
To get this:
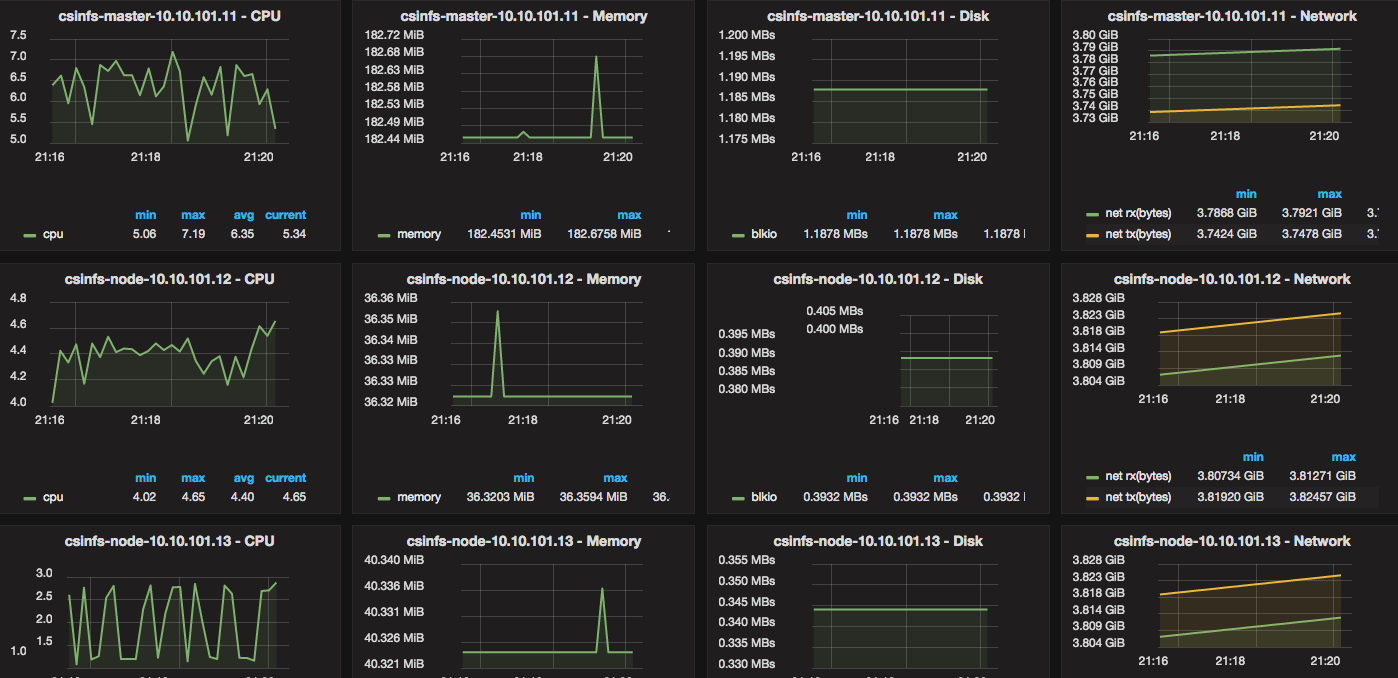
There are 3 components that are started via containers:
Grafana (dashboard/visual metrics and analytics)
InfluxDB (time-series DB)
Telegraf (time-series collector) – 1 per Docker host
The idea is that you first launch Grafana, and then launch InfluxDB. You configure Grafana (via the web) to point to InfluxDB’s IP, and then you setup a Telegraf container on each Docker host that you want to monitor. Telegraf collects all the metrics and feeds them into a central InfluxDB, and Grafana displays them.
Setup Tutorial/Examples
Continue Reading →Monitor Docker resource metrics with Grafana, InfluxDB, and Telegraf