I needed a way to monitor Docker resource usage and metrics (CPU, Memory, Network, Disk). I also wanted historical data, and ideally, pretty graphs that I could navigate and drill into.
Whatever the solution was going to be, it had to be very open and customizable, easy to setup and scale for a production-like environment (stability, size), and ideally cheap/free. But most of all — it had to make sense and really be straight forward.
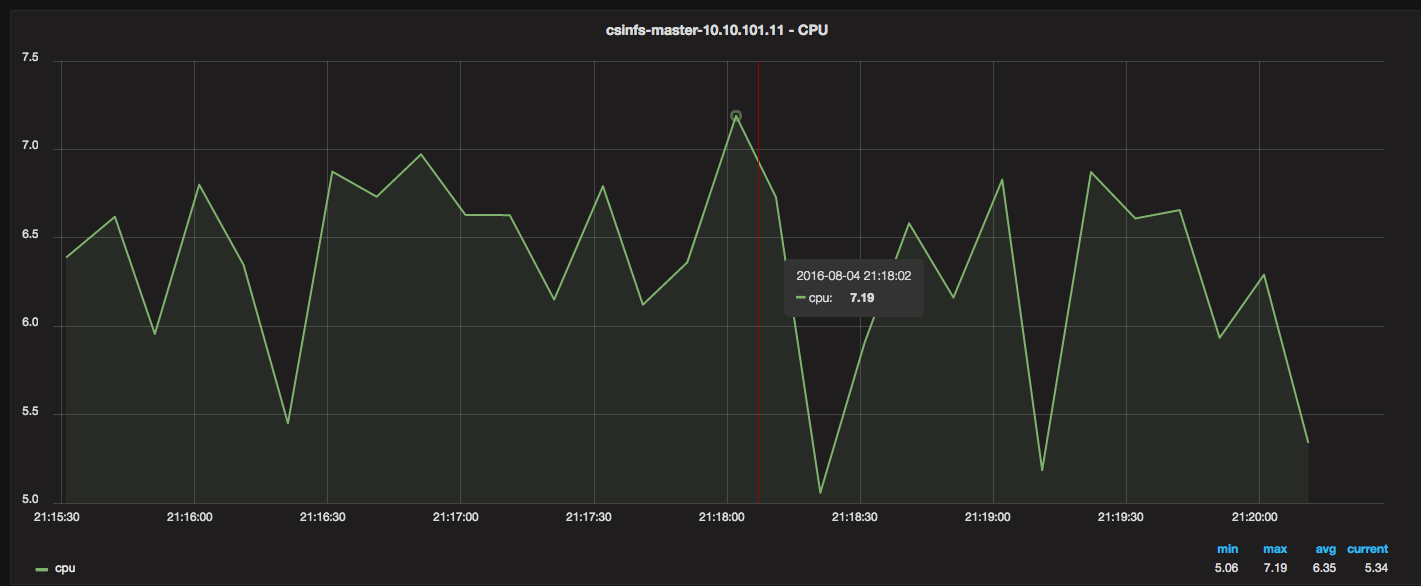
3 Containers and 10 minutes is all you need
To get this:
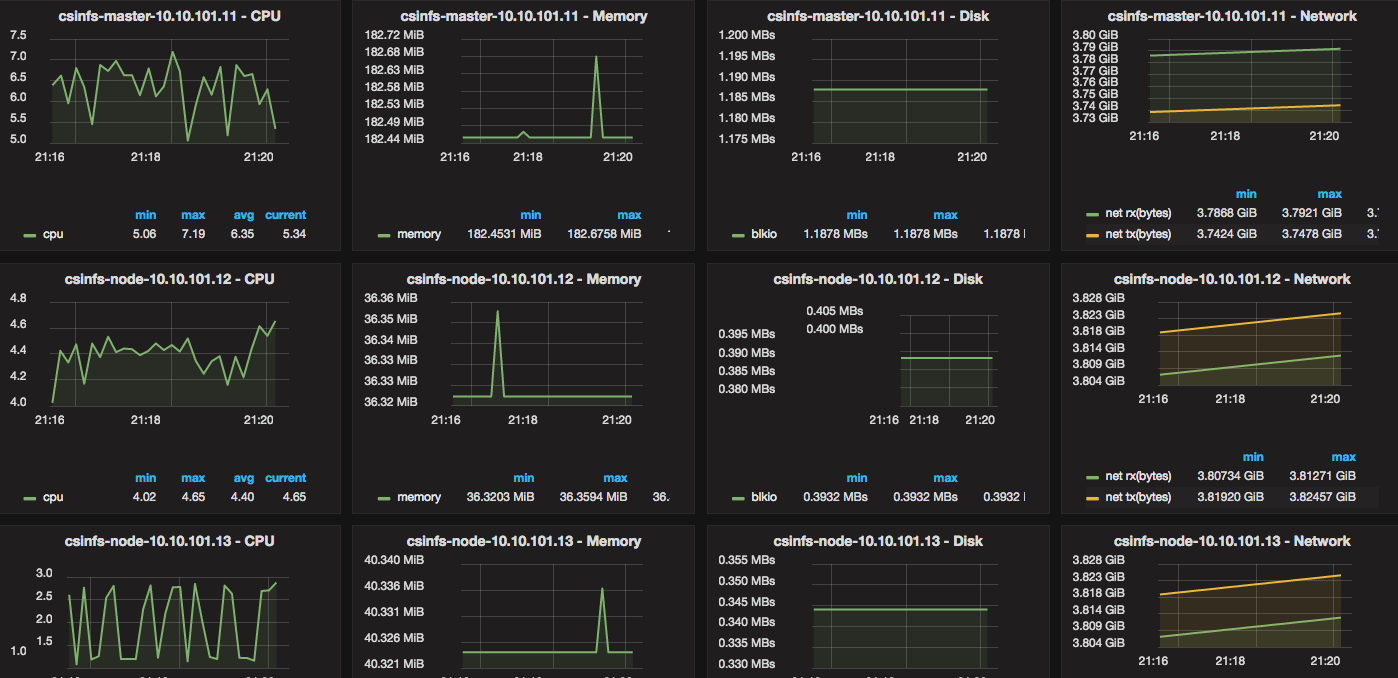
There are 3 components that are started via containers:
Grafana (dashboard/visual metrics and analytics)
InfluxDB (time-series DB)
Telegraf (time-series collector) – 1 per Docker host
The idea is that you first launch Grafana, and then launch InfluxDB. You configure Grafana (via the web) to point to InfluxDB’s IP, and then you setup a Telegraf container on each Docker host that you want to monitor. Telegraf collects all the metrics and feeds them into a central InfluxDB, and Grafana displays them.
Setup Tutorial/Examples
In our example, we have a bunch of servers running Docker:
vm01, vm02, vm03 [VM IPs do not matter in this case]
A “data” folder (/data) on each vm for the data mounts.
And we create an empty folder for each container: “/data/grafana”, “/data/influxdb”, “/data/telegraf”
A common network overlay or macvlan network (docker 1.12+) — we use the name “someNetworkName”
Static IPs (either via “–ip” directly, or something like pipework)
We will launch Grafana and InfluxDB on vm01, and a Telegraf container on vm01, vm02, and vm03.
Grafana (10.0.0.10)
InfluxDB (10.0.0.20)
Telegraf (10.0.0.101 on vm01, 10.0.0.102 on vm02, and 10.0.0.103 on vm03)
Grafana
Beautiful metric and analytics dashboard. Ideal for visualization and querying of time series data.
This is the first container you will launch on vm01:
(note: you are mounting the dirs so that you can access/change the configs, and data that is generated. Dirs can be empty)
NOTE: For Grafana, using ALL defaults works. That means you can either specify the “-v” for the /etc/grafana, /var/lib/grafana, and /var/log/grafana — or skip it. It would make sense to specify the logs to have them, and it would make sense to specify the rest if you want to 1.) override something and/or 2.) add plugins. Otherwise, you are fine with defaults. I will provide the “default” config in the comments bellow.
|
1 2 3 4 5 6 7 8 9 10 11 12 |
docker run --restart=always -d --net=someNetworkName --ip=10.0.0.10 \ --name grafana \ --hostname grafana \ -v /data/grafana/var/lib/grafana:/var/lib/grafana \ -v /data/grafana/etc/grafana:/etc/grafana \ -v /data/grafana/var/log/grafana:/var/log/grafana \ -p 3000:3000 \ -e "GF_SERVER_ROOT_URL=http://10.0.0.10" \ -e "GF_SECURITY_ADMIN_PASSWORD=somepasswordhere" \ grafana/grafana |
InfluxDB
Time-series data storage. A database designed for time-series data. Very easy to use, and feeds data into Grafana. It can accept data from many tools, specifically collectors like Telegraf.
First generate a config file:
|
1 2 3 |
docker run --rm influxdb influxd config > /data/influxdb/influxdb.conf |
Then run the container as your second container on vm01:
|
1 2 3 4 5 6 7 8 9 |
docker run --restart=always -d --net=someNetworkName --ip=10.0.0.20 \ --name=influxdb \ --hostname=influxdb \ -p 8083:8083 -p 8086:8086 \ -v /data/influxdb:/var/lib/influxdb \ -v /data/influxdb/influxdb.conf:/etc/influxdb/influxdb.conf:ro \ influxdb -config /etc/influxdb/influxdb.conf |
Telegraf
Time-series data collection. This uses a config to know what data to collect and where to feed it.
First generate a config file:
|
1 2 3 |
docker run --rm telegraf -sample-config > /data/telegraf/telegraf.conf |
Edit the config and just enable the Docker portion (uncomment the “[[inputs.docker]]” section until the timeout)
The only other config line you need is this:
|
1 2 3 4 5 6 |
[[outputs.influxdb]] #urls = ["http://IP-or-NAME-of-INFLUXDB:8086"] # required urls = ["http://10.10.10.20:8086"] # required database = "telegraf" # required |
Then run the container as your third container on vm01 (and later on vm02, and vm03, with changes bellow code):
|
1 2 3 4 5 6 7 8 9 10 11 12 13 |
docker run -d --restart=always --net=admin01 --ip=10.0.0.101 \ --add-host="influxdb:10.0.0.20"\ --name=stats-s01 \ --hostname=vm01 \ -e "HOST_PROC=/rootfs/proc" \ -e "HOST_SYS=/rootfs/sys" \ -e "HOST_ETC=/rootfs/etc" \ -v /data/telegraf/telegraf.conf:/etc/telegraf/telegraf.conf:ro \ -v /var/run/docker.sock:/var/run/docker.sock:ro \ -v /sys:/rootfs/sys:ro -v /proc:/rootfs/proc:ro \ -v /etc:/rootfs/etc:ro telegraf |
NOTE: You will launch the almost the same thing on vm02 and vm03, but you would change the –hostname (vm02, and vm03) and –ip (10.0.0.102, and 10.0.0.103)
Last Step – Connect via Web and Start Using
Log into http://10.0.0.10:3000 (admin, and password from docker “GF_SECURITY_ADMIN_PASSWORD”), and go to:
1.) The top left Menu (icon of Spiral)
2.) Data Sources
3.) + Add data source
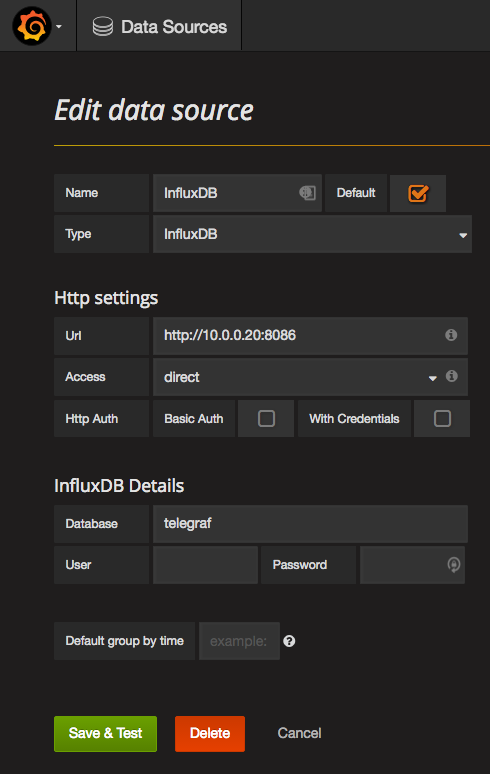
4.) Fill out:
a.) Name: InfluxDB
b.) Type: InfluxDB
c.) (HTTP Settings) Url: http://10.0.0.20:8086
d.) (InfluxDB Settings) Database: telegraf
5.) Click “Save & Test” — it will save and work (ignore the “Please fill out this field — this is for production environments — setting up DB users, and eventually SSL)
It should look like this:
That’s it! You are Done!
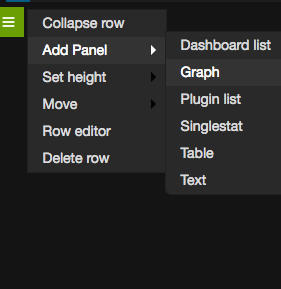
Now you can go to the top left menu -> Add a new Dashboard -> Add a panel, and start adding Graph (or other) data.
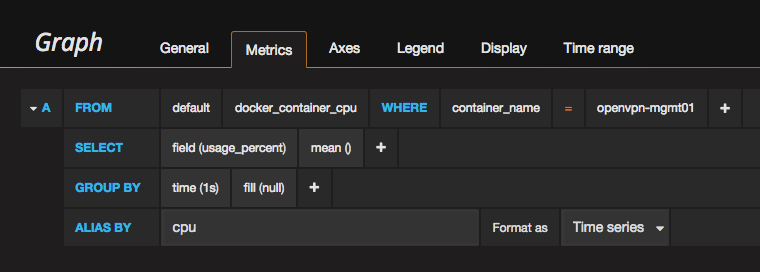
For Graph for example, under the Metrics tab, you can access all of the variables in a point and click method.
Here’s a example to add a new graph on a new Row (after you create a Panel):
And here’s an example of how you would modify the “search” by point and click:
How I came to this solution (skip if you are not interested)
After some research, I realized just how bad of a state the currently available solutions and tutorials/example/documentation were. They were either too simple and not useful (CAdvisor), not fully implemented (Stats, Scout), extremely complicated in design and difficult to setup or lacking documentation (Sensu, Prometheus, etc.), or just expensive (DataDog, SysDigCloud).
And the tutorials on docker and metrics were basically non existent. Rancher’s guide is the most “current and complete” doc on this as of today, in terms of what’s available, and you can find it HERE.
Hi Ventz,
I am not able to start any of the container, instead was taking the following approach to run telegraph, influxdb and grafana
1. Install Influxdb as container:
docker run -d -p 8083:8083 -p 8086:8086 –expose 8090 –expose 8099 -e PRE_CREATE_DB=telegraf –name influxsrv tutum/influxdb:0.8.8
2. Install Telegraph as contianer:
docker run –volume=/:/rootfs:ro –volume=/var/run:/var/run:rw –volume=/sys:/sys:ro –volume=/var/lib/docker/:/var/lib/docker:ro –publish=8085:8085 –link=influxsrv:influxsrv –detach=true –name=telegraph bbailey/telegraf -storage_driver=influxdb -storage_driver_db=telegraph -storage_driver_host=influxsrv:8086
3. Install Grafana as container:
docker run -d -p 3000:3000 -e HTTP_USER=admin -e HTTP_PASS=admin -e INFLUXDB_HOST=localhost -e INFLUXDB_PORT=8086 -e INFLUXDB_NAME=telegraf -e INFLUXDB_USER=root -e INFLUXDB_PASS=root –link=influxsrv:influxsrv grafana/grafana:2.0.2
Grafana and Influxdb got up and running, but telegraph is not getting installed getting the following error
docker: Error response from daemon: oci runtime error: container_linux.go:247: starting container process caused “exec: \”-storage_driver=influxdb\”: executable file not found in $PATH”.
Could you please let me know what to be done to solve this error?
Thanks,
PD
Thanks for the configs and explanations!
Hi Ventz,
Could you please clear the following confusion
1. How can I get the following;
grafana.ini “default” config (you can pre-generate from grafana itself/using docker) into /data/grafana/etc/grafana
– or it’s just required to create a empty file in that name “grafana.ini”
– if you have the docker command for the same, please send me.
2. docker run –restart=always -d –net=someNetworkName –ip=10.0.0.10 \
–name grafana \
–hostname grafana \
-v /data/grafana/var/lib/grafana:/var/lib/grafana \
-v /data/grafana/etc/grafana:/etc/grafana \
-v /data/grafana/var/log/grafana:/var/log/grafana \
-p 3000:3000 \
-e “GF_SERVER_ROOT_URL=http://10.0.0.10” \
-e “GF_SECURITY_ADMIN_PASSWORD=somepasswordhere” \
grafana/grafana
What will be the someNetworkName? will it be a valid network name? or just any name?
What will be the ip? 10.0.0.10? is it just a arbitrary ip? or a valid ip is required?
Thanks,
PD
Hi Prasenjit,
Thanks for posting it here. I know I sent you some of the info via email, but will post here in case it helps others.
For #1 – posted the full default config, but the summary is that you don’t need it. You can choose to run the docker container without any volume mounts and it will work “as is” (update the instructions to reflect this info). The volume override is probably the most useful just for the logs.
For #2 – the network comes in if you use internal networks, overlays, or macvlans. In that case, you control the subnet. If you are not using any of these, don’t worry about the network and IP portion – use it as without it. If you do go without it, you will need to run the containers on the same physical host and “link them” (using the names) as Youri mentioned.
Hope this helps.
Nice, thanks!
I guess something has changed, my default config pointed to localhost.
Nevertheless I’ve chosen to go with linking containers instead of using ip’s. This also allows me to only expose the grafana port (3000). But I’m also just monitoring one machine. Linking is probably not possible when you want to connect multiple machines over a network.
Cheers!
Youri – I went through the setup. It turns out the defaults are truly sufficient, without any overrides. That is, you don’t have to specify any mount overrides via “-v” at all (I updated the post to reflect this info). I specified them because the logs are actually helpful, and also to show the different mounts that are user override-able. At last, if you want custom plugins, that would be another reason.
Either way – here is the default config in case you/anyone else wants it:
Also updated the telegraf config section. Thanks for pointing that out – there are 2 sections that should be updated there:
1.) docker inputs:
2.) influxdb outputs:
Thanks for the guide! Helped me out a lot.
Initially it didn’t work for me because there was no grafana.ini located at /data/grafana/etc/grafana.
After putting a default grafana.ini in that location it worked.
Also, I had to ensure telegraf was saving to influxdb:
[[outputs.influxdb]]
urls = [“http://influxdb:8086”]
Youri – glad it helped. Yea, you have to “create” the grafana.ini in that location.
I added a note to the post just so that it’s clear for others (thanks!)
For Telegraf, it should be “pointing” to Influx from this:
(obviously, using whatever IP you have chosen).
The default config should have influxdb by name and on that port, but it’s possible that something has changed recently.